
Turbulence is the part of flying people fear most and pilots worry about least — because to a crew it's rarely a surprise. Long before the seatbelt sign chimes, the flight deck has a fairly good idea of where the ride will get rough, built from forecasts, charts, and reports from the aircraft ahead. Here's how pilots know where the bumps are, what actually causes them, and how you can check the turbulence forecast for your own flight.
What actually causes turbulence
Turbulence is just air moving in a way the aircraft has to fly through. It comes in a few distinct flavors, and knowing which is which is half of forecasting it:
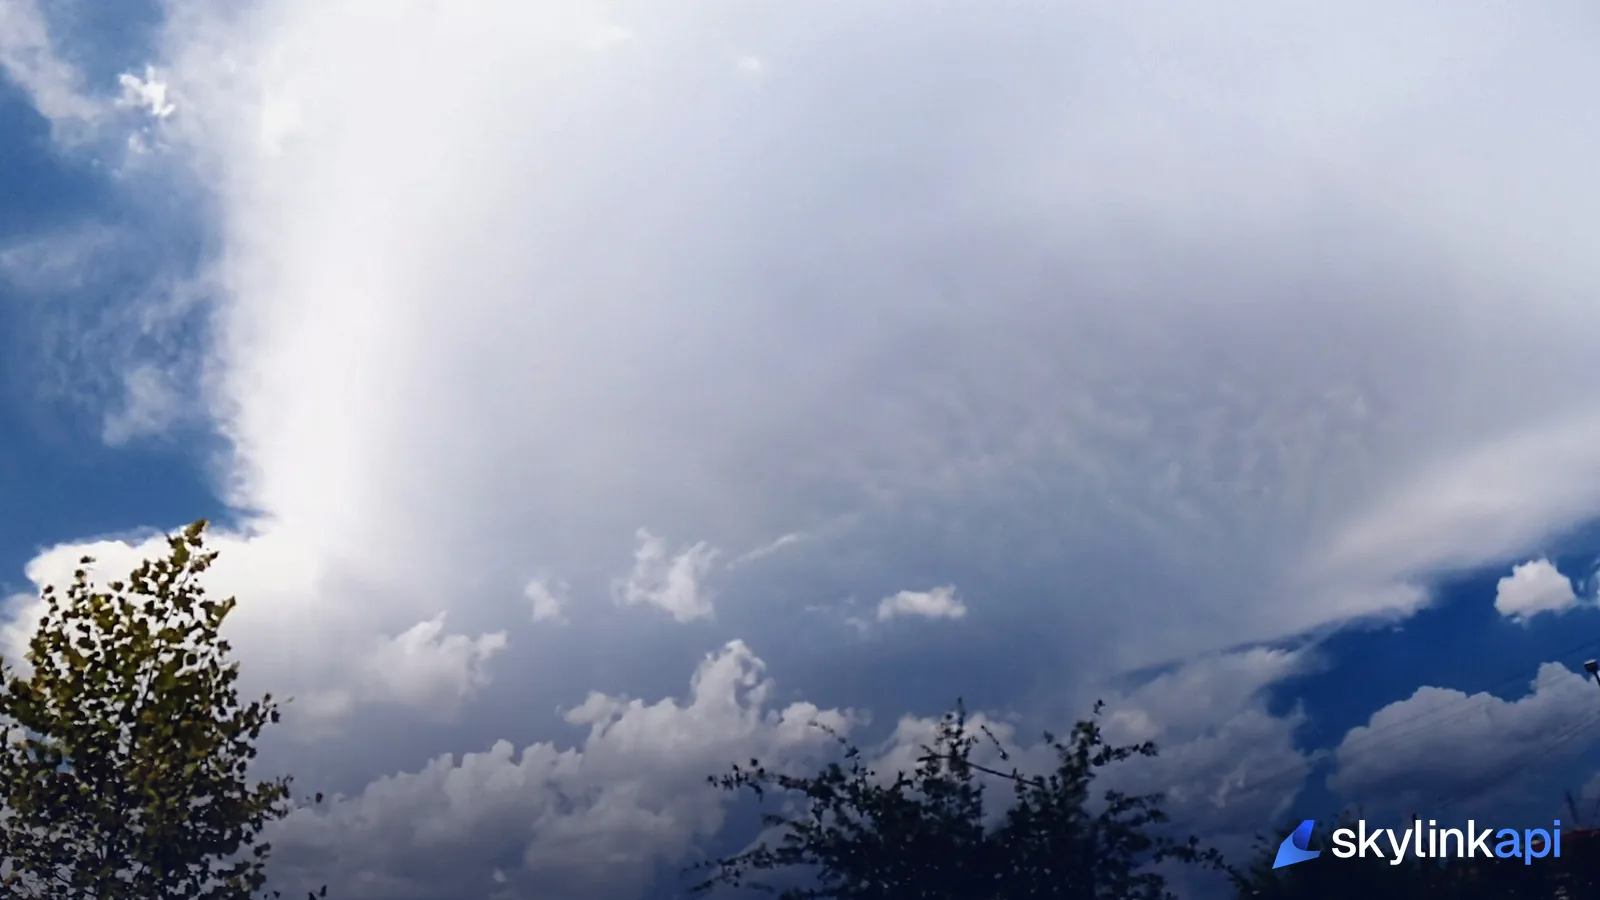
- Convective turbulence. The big one. Rising and sinking air around thunderstorms and towering cumulus — violent, localized, and the reason crews route around storm cells rather than through them.
- Clear-air turbulence (CAT). The sneaky one. Found near the jet stream at cruise altitude where fast and slow air shear against each other. There are no clouds to see it coming, which is exactly what makes it hazardous.
- Mountain-wave turbulence. Air flowing over high terrain sets up waves downwind that can reach far above the peaks — sometimes marked by lens-shaped lenticular clouds.
- Mechanical and wake turbulence. Low-level bumps from wind over rough ground or buildings, and the invisible wake vortices trailing behind a heavy aircraft.
How pilots see it coming
A crew builds its turbulence picture in two stages. Before the flight, dispatch and the pilots read the hazard forecasts: SIGMETs and AIRMETs — official advisories that call out areas of forecast moderate or severe turbulence — plus winds aloft to spot the jet-stream shear that breeds clear-air turbulence, and dedicated turbulence forecast charts. We break the advisories down in SIGMETs, AIRMETs, and PIREPs explained.
In the air, the picture sharpens. The weather radar paints convective cells ahead so the crew can deviate around them. And crucially, pilots share what they're actually feeling through PIREPs — pilot reports — a controller relaying "moderate chop reported at flight level three-four-zero" is the single most useful, up-to-the-minute turbulence data there is, because it's a real aircraft in the real air minutes ahead of you.
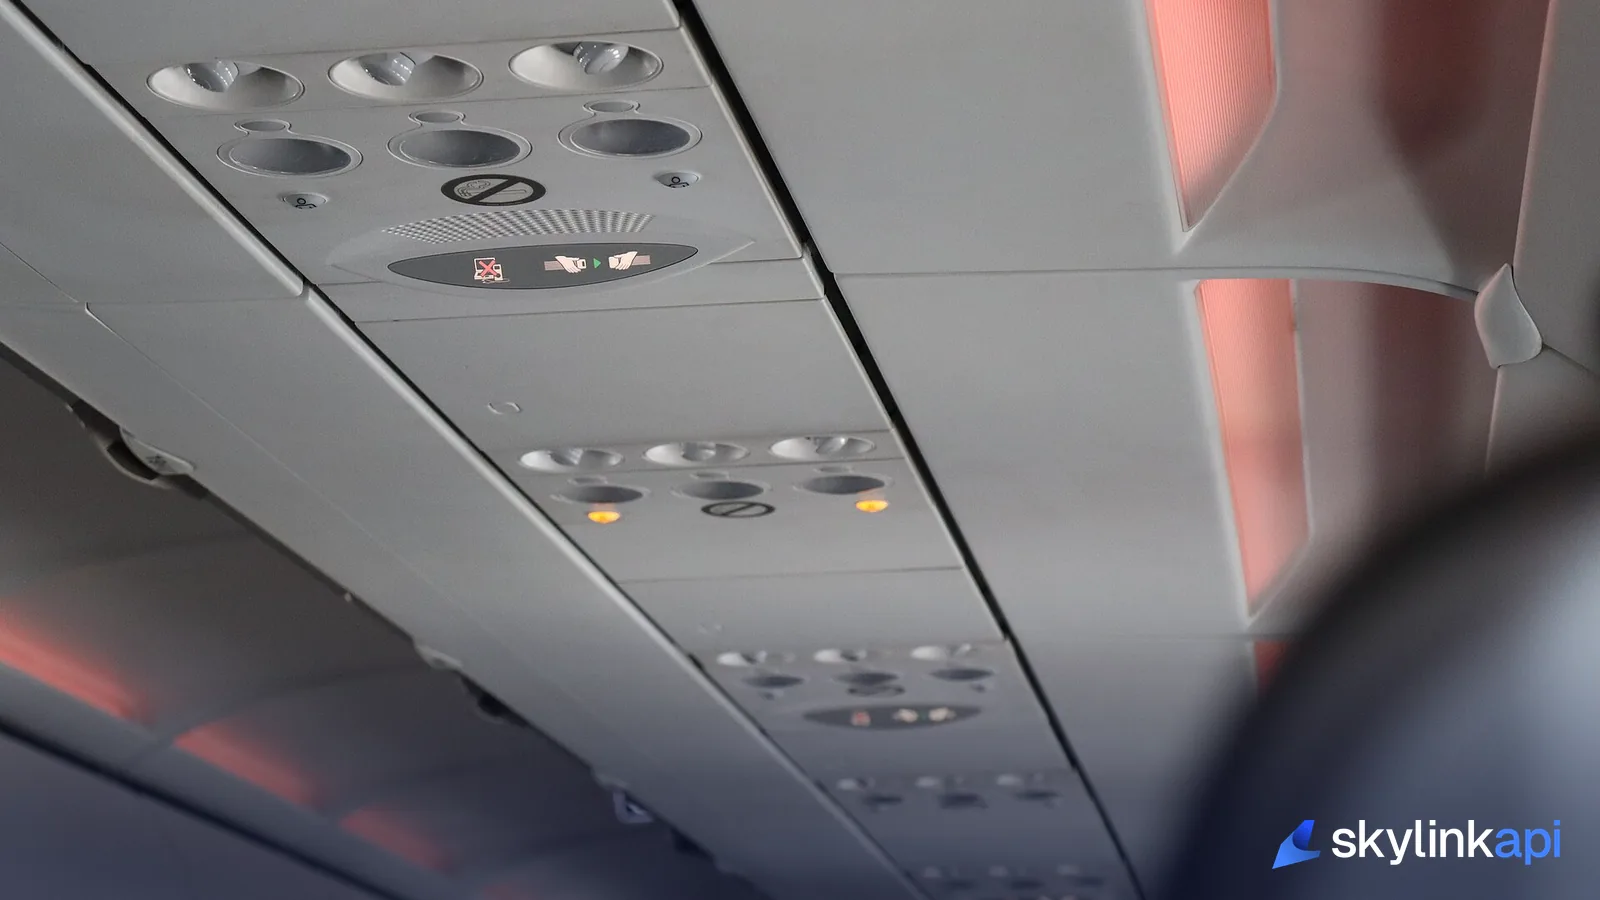
The fasten-seatbelt call
That flow is what's behind the seatbelt sign. When the forecast, the radar, or a PIREP says rough air is coming, the crew turns the sign on before the aircraft reaches it — which is why the sign often illuminates while the ride still feels smooth. Clear-air turbulence is the exception that proves the rule: with no cloud and no radar return, sometimes the only warning is a report from the aircraft ahead, which is why crews leave the sign on near known shear zones and ask you to keep your belt fastened even when seated.
Checking the turbulence forecast yourself
You don't need a dispatch license to see the same data. The hazard products the pros use are available by API, so you can check the forecast for a route — or build turbulence into a flight-tracking app — yourself.
SkyLink API's PIREPs endpoint returns recent pilot reports in a bounding box, each with a decoded turbulence field and the altitude it was observed at:
# Recent pilot reports over the New York–Boston corridor, last 3 hours
curl "https://skylink-api.p.rapidapi.com/weather/pireps?bbox=40,-74,43,-70&hours=3" \
  -H "X-RapidAPI-Key: $RAPIDAPI_KEY" \
  -H "X-RapidAPI-Host: skylink-api.p.rapidapi.com"
Each report tells you the turbulence intensity (Light, Moderate, Severe), the flight level, and the aircraft type that filed it. Pair that with the AIRMET/SIGMET endpoint for the official forecast advisories and winds aloft for the jet-stream shear, and you've reconstructed the exact turbulence picture a flight crew works from — or you can pull it all at once from the one-call flight briefing.
SkyLink API gives you a free tier of 1,000 requests/month across PIREPs, AIRMET/SIGMET, and winds aloft, with paid plans starting at $19/mo for production. It's available through the free trial — sign up, grab a key, and put the turbulence forecast in your own app.